Reality check: no candle guarantees a win. Context + level + confirmation is what improves odds.
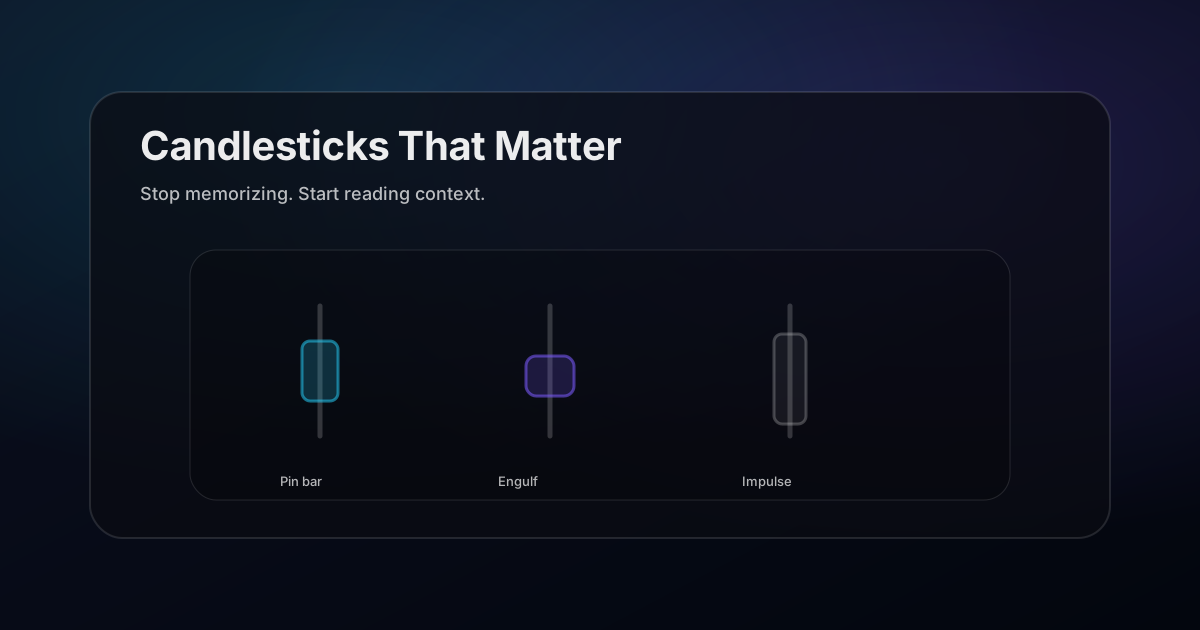
1) Rejection candles (pin bars / long wicks)
A long wick shows price tried to go somewhere and got rejected. These work best at support/resistance or after a liquidity sweep (taking an obvious high/low).
- Trigger: break of the rejection candle’s high/low (directional)
- Invalidation: beyond the wick (or beyond the zone)
2) Engulfing candles (shift in control)
An engulfing candle shows a stronger response than the prior candle. It’s most useful when it aligns with structure (for example, the first strong push after CHoCH).
- Trigger: follow-through or a retest of the engulfing range
- Invalidation: acceptance back into the range in the wrong direction
3) Impulse candles (momentum + acceptance)
Big candles are not “buy now” signals. They’re evidence of acceptance. After an impulse, you often get a pullback into a key level (break and retest).
- Best use: as breakout confirmation, then trade the pullback
- Trap: chasing the candle top into resistance
Where candles fail
- in low-liquidity chop
- mid-range with no key level nearby
- right before major news releases (random wicks)
A prompt for AI candle reading
Analyze this chart screenshot for candlestick context.

1) Identify the most important candle(s): rejection / engulf / impulse
2) What key level or structure context makes it meaningful?
3) Give a trigger + invalidation + target zone.
Location decides whether a candle means anything
The same candle carries completely different information depending on where it forms. A bullish engulfing candle at a well-tested support level after an extended decline is a genuine signal. The identical candle in the middle of a range is a coincidence of two adjacent bars.
This is why pattern-first trading disappoints so consistently. If you scan for engulfing candles you will find dozens per day per instrument, and the overwhelming majority occur nowhere important. The pattern is not the edge, the pattern is the timing mechanism for an edge that already existed because of where price is.
Reverse the order of operations. Find the level first and decide what you want to see there. Then let the candle tell you the moment participants at that level actually showed up. A rejection candle you were waiting for at a level you marked in advance is worth many times a rejection candle you discovered by scrolling.
What the candle is telling you about the auction
Every candle is a compressed record of a fight, and reading it that way is more durable than memorising names. Four pieces of information sit in each bar: where trading opened, where it closed, and the two extremes it was rejected from.
A long lower wick means price traded down there and was pushed back, so buyers appeared with enough size to reverse it within the period. A small body means neither side finished in control. A large body with little wick means one side dominated from open to close with no meaningful pushback, which is a very different message from a large body with wicks at both ends.
Once you read candles as records of who won and by how much, you stop needing the pattern names. You can look at any bar and describe what happened, including the many shapes that have no name at all but tell you plenty.
The follow-through candle matters more than the pattern
A reversal candle is a hypothesis. The next candle is the test. This single habit filters out a large share of losing candle trades, because failed patterns fail immediately and visibly.
After a bullish rejection at support, the following candle should hold above the rejection candle's low and ideally close higher. If the next candle instead trades straight through that low, the buyers who created the wick have been overwhelmed, and the pattern is void regardless of how textbook it looked.
Entering on the close of the pattern candle gets you a better price and a worse win rate. Waiting for confirmation costs you some of the move and removes the trades that were never going to work. For most traders the second approach produces better results, because the improvement in quality outweighs the worse entry.
Timeframe changes everything
A daily engulfing candle represents a full session of participation across every type of market participant. A one minute engulfing candle represents sixty seconds, possibly driven by a single order. They share a shape and share nothing else.
As a rough guide, treat candle patterns as meaningful on four hour charts and above, as usable with confirmation on the hourly, and as largely decorative below fifteen minutes. This is not snobbery about lower timeframes, it is about how many participants had the opportunity to act within the period.
There is also a closing-time effect worth knowing. Daily candles close at a specific hour that differs between data providers, so the same instrument can show an engulfing pattern on one feed and not on another. If a pattern only exists on one chart and disappears on another, it was never a consensus event, and consensus is the entire reason the pattern was supposed to matter.
Volume turns a candle into evidence
A rejection candle on average volume is a suggestion. The same candle on volume well above its recent average is evidence, because the wick now represents real participation rather than a thin patch in the order book.
The comparison that matters is against the instrument's own recent volume, not an absolute figure. Roughly one and a half to two times the recent average is a meaningful expansion. Below average volume on a supposedly decisive candle is a warning that the move lacked participants, and those candles are reversed far more often.
This is especially true for engulfing candles. An engulfing bar that swallows the previous candle on low volume often just reflects a quiet period where little traded. The pattern is about a transfer of control, and control cannot transfer if almost nobody was present.
The patterns worth ignoring
Candlestick literature contains dozens of named formations, and most of them add nothing over the three or four that describe rejection, control, and momentum. Three-candle patterns in particular tend to be rare enough that you will never build a usable sample, and specific enough that you will be tempted to force chart data to fit them.
Doji candles deserve a particular caution. A doji means indecision, which is genuinely useful information at a significant level after an extended move, and completely meaningless in the middle of a quiet session where most candles are small anyway. Context does all the work.
Building the habit of reading rather than matching
A useful exercise is to open a chart, pick any candle, and describe in one sentence what happened during that period without using a pattern name. Where did it open, who pushed it, where were they rejected, who finished in control.
After a few weeks of this, pattern names become unnecessary. You will spot the moments when control changed hands regardless of whether the shape has a Japanese name attached, and you will stop missing significant candles simply because they did not match a diagram.
This also protects you from the biggest trap in candlestick trading, which is pattern hunting. Once you know the names, you see them everywhere, including in places where they mean nothing. Reading the auction keeps your attention on what the bar is telling you rather than on what it resembles.
Candles at the open and the close
The first and last candles of a session behave differently from everything in between, and applying normal pattern logic to them produces poor results.
The opening candle absorbs everything that happened while the market was shut, so its size reflects accumulated news rather than an intraday battle. The closing candle is shaped by position squaring and by traders who must be flat, which is a mechanical pressure rather than a directional opinion. Discount both accordingly.
Related posts
- Support & Resistance Trading (Simple Levels That Actually Work)
- Break and Retest Strategy (How to Trade It Clean)
- RSI Divergence
- Market Structure: BOS vs CHoCH
- AI Trading Chart Analysis Workflow
Get ChartsGPT
Turn your screenshot into key levels, scenarios, trigger, and invalidation in seconds.


About ChartsGPT
ChartsGPT is an AI chart analysis app designed to turn screenshots into structured levels and scenarios. For support, contact anthonyvvza@gmail.com.